


Dataporn April 2016
 Here’s something different for a change: I’ve prepared a few interesting numbers for you to peruse, in case you’re interested what kind of income writing erotica will provide. For background, I’ve started publishing in August 2015 and initially have been (pretty much) exclusively with Amazon, which is still the strongest market for my books. Amazon has a program called “Kindle Unlimited” which offers authors the ability to distribute their books to a wider audience, but the compensation for that is much less than what I would get if I just sold my books the traditional way. (KU pays out around 0.5 Cents per page read, so if someone just read all the way through your 300-page novel, for example, then CONGRATULATIONS: You’ve just earned US$ 1.50!) Still, I tried it initally, not to a very great success I might add, but once you do, you’ll enter a 90-day exclusivity contract with Amazon, during which time you can’t publish your work anywhere else.
 Well. Once that time had run out, I started publishing my stuff on every other retailer I could get my hands on, starting in November 2015. Due to the delayed nature of the sales reports, the first month I’ve got numbers for is January 2016. I intentionally didn’t put any numbers to the chart so as not to get into any kind of a measuring contest. This is about the sales relations, not about how rich or poor I am. Also, these charts are based on sales income, not on the amount of books sold.
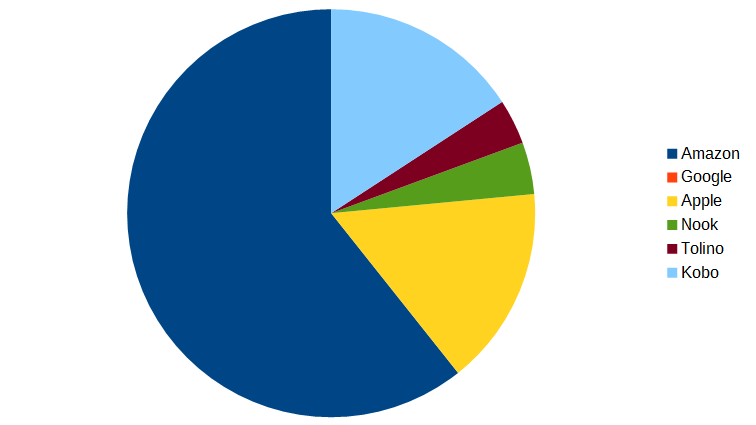
As you can see, sales from other channels made up about 40% of my total income, which is a ratio that would pretty much stay true, if not increase, in the months to come, because January didn’t include sales from Google (which I had started later and wouldn’t get any reports on until February). As could’ve been predicted, Apple was the largest non-amazon sales channel, and I’d be more happy about that if they weren’t so very picky about what books they sell, how they are presented, what words are and aren’t allowed in the summary, etc. But I don’t want to complain, they pay the bills, just like anyone else.
The only surprising thing about the January stat is the amount of Kobo sales. Sadly, this didn’t hold true for the coming months, so it must be some kind of “fresh publication effect”. (Typically, book sales have an initial surge, when they’re first published.)
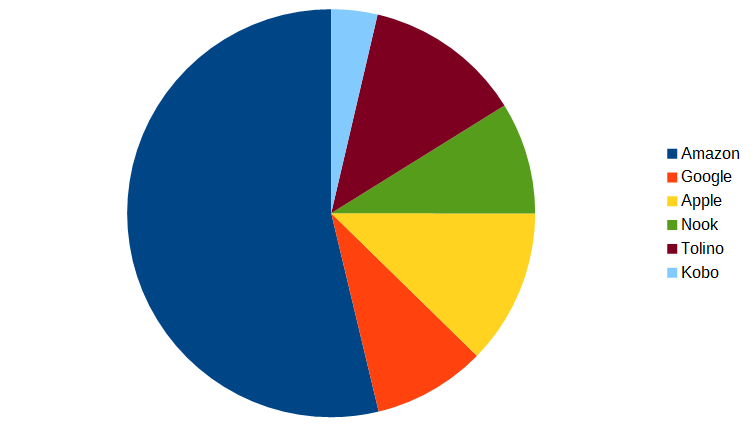 In February, then, sales outside of Amazon actually grew as Google joined the ranks. As you can see, the sales are pretty much equally distributed among the four major channels – Google, Apple, Nook (Barnes & Noble) and Tolino.
The Apple-level is really quite steady, their numbers don’t change much. Kobo dropped form being the largest non-amazon income in January to almost nothing in February while Tolino and Nook picked up considerably. Google sales are significant, though not overwhelming, but it’s the first month and I’m actually not quite sure what time period they cover (the report isn’t really very clear on that).
Maybe this is a good time to mention that I’m not selling on any of those platforms (except Amazon) directly – Google and Apple don’t allow self-published authors in any more and the others are just too much of a pain to deal with on an individual level (*cough* Nook, fix your publicaton platform, it’s an embarrassment *cough*), so I’m using a few third-party services that will then distribute my books across a wide range of platforms. That’s also why my Google reports are different from, say, my Apple reports, and I somehow have to make sense of all these numbers. In the end, I’m just inserting the income I get from whatever time period a certain report covers. That does NOT mean all the sales were from that time period, though, which is a long winded way of saying that I believe those Google sales were actually just from part of January. Otherwise I couldn’t explain the March results, really.
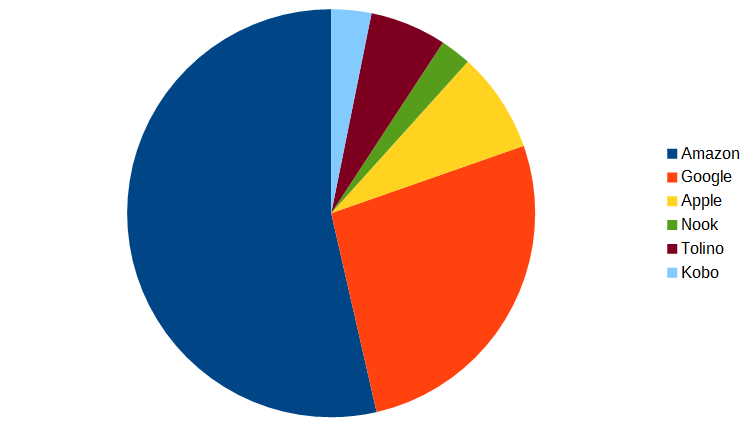 Because last month, Google sales picked up like SHIT, by FAR eclipsing all other non-amazon sales COMBINED. I’m really quite impressed by that, and curious to see if that trend will keep up in the following months.
As you can see, sales outside of Amazon still pretty much make up just about 45-50% of my total sales, even though Google picked up so much. The reason for that is that last month, my Amazon sales had increased tremendously (by about 50% compared to the previous month) while the sales of the other channels have pretty much stayed on the same level. To be quite honest, sales from Nook and Kobo are negligible and I wouldn’t go bankrupt without them, which is a shame, because they both have a really neat platform and devices that aren’t any worse than the kindle. I’d say they will need to spend a lot more money on marketing to make any dent in the ebook market at this rate, though.
Tolino, on the other hand, is an interesting case. I wouldn’t be surprised if you’ve never heard of it – it’s an ebook platform with its own reader and closed ecosystem that predominantly targets a german language market. The reason I’m getting a good income from them is that I’ve got a lot of my books translated into german and they prove to be really quite popular there. So Tolino, even with its limited audience, makes up a good chunk of my sales.
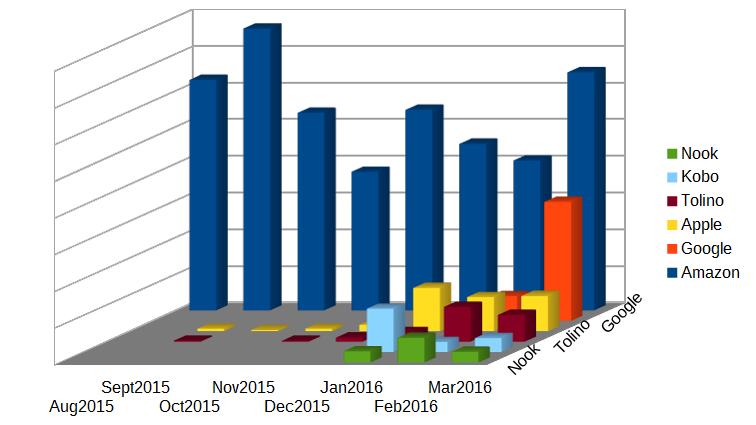 All in all, I’m really quite happy with the way things haven been going this year. One last chart here shows you the sales in total numbers (albeit, again, without the numbers) instead of in relation to one another, and even though my Amazon sales have fluctuated a little bit, sales from other channels have been increasing nicely. You can also see some sales on Apple and Tolino from last year, but these were really miniscule, coming from just a handful of titles that I didn’t have in KU. Not included are sales from many minor platforms (Scribd, Bookmate, etc.) where I only had a couple of sales that didn’t make a dent in things, as well as sales from Smashwords, where it’s hard to get monthly reports. My sales there are between the Nook/Kobo and Apple level, though.
In the end, my goal was to not be reliant on Amazon exclusively as my source of income, a mission that I pretty much have achieved. I simply feel safer publishing my things when I don’t have to be afraid of getting the boot from my only source of income over something I’ve written (which is a really quite realistic danger that has befallen many other erotica authors before).
On top of that, March has been my best month so far, as far as total sales are concerned, and my second-best month on Amazon, which is nice to see after the decline of sales last year. Obviouly, my strategy of publishing regularly every week is paying off.
So there you have it. Sales, charts, colours and graphs, all just for you. Also, here’s a pretty lady. Enjoy.

Ein wirklich wahrer text, ich mein ich bin zwar für offenes direktes freizügiges da sein und ausleben seiner Sexualität und seiner Neigungen.
Eine wirklich währe Sicht der Dinge, finde ich persönlich, sehr gut. Man sollte definitive zu seinen Neigungen, erotischer bzw. sexueller hinsicht, stehen bzw. sie auch ausleben können.